
Google Search Insights: Designated Market Area (DMA) , State, and National Trends
The purpose of this project is to create a scalable, data-driven dashboard that reveals how search interest varies across U.S. regions. By combining search trends with demographic context, the goal is to help users identify regional patterns, compare interest across different states, and explore the topics that define each part of the country. This can be valuable for businesses, supporting regional targeting, product launches, and strategic decision-making by highlighting what specific audiences in each state are actually interested in.
Results
Texas is a good market to consider for a product launch because it has the second largest share of 15–34 year olds, making up 28.76% of the population. College Football and Soccer show slightly higher popularity in Texas compared to the U.S. benchmark, suggesting stronger local interest in these topics. NFL search volume is high, but Texas falls below the national benchmark, which makes it a weaker option when the goal is to focus on topics that are more locally popular. At the DMA level, Dallas–Fort Worth offers the largest reach among younger audiences with income slightly higherto the state average, while Odessa–Midland reaches fewer people but has much higher income levels. These patterns suggest a strategy focused on products related to College Football and Soccer, using large DMAs for reach and higher-income DMAs for more targeted or premium pricing approaches.
Resources
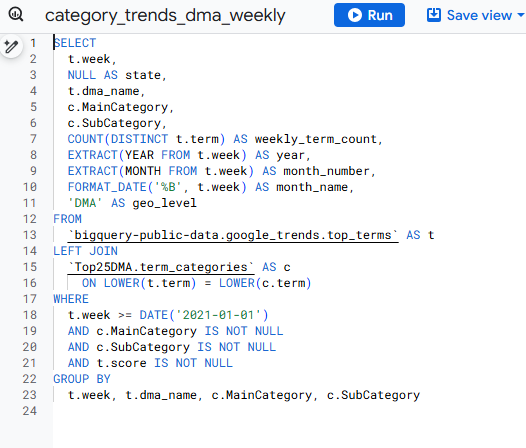
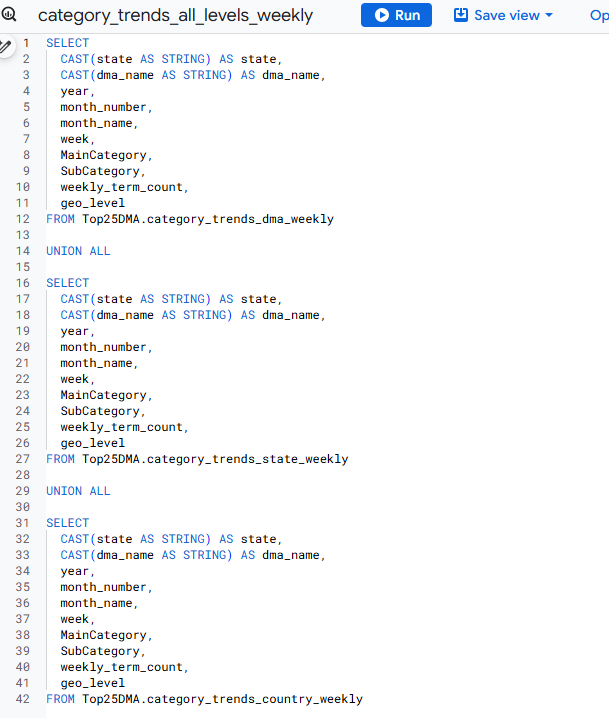
BigQuery - SQL
BigQuery served as the foundation of my data pipeline and handled all of the heavy lifting required for this project. I used it as the primary data warehouse to process millions of rows from Google Trends’ Top 25 weekly search terms across all 210 DMAs. BigQuery was ideal for large-scale operations such as filtering four years of historical data, joining multiple demographic datasets, and extracting DMA rankings. Its distributed SQL engine allowed me to clean, normalize, and structure the data efficiently before exporting only the essential, analysis-ready tables.

Tableau Public - Desktop
Tableau served as the front-end experience for this project, bringing together all DMA-, state-, and national-level datasets into a single interactive dashboard. To support complex navigation across levels and ensure that interactions behaved correctly, I designed a structured Tableau data model with clean relationships, custom filtering logic, and parameter-driven controls. The result is a fully dynamic dashboard where every selection, whether a term, DMA, state, or category, updates all relevant charts simultaneously and without conflict.
VS Code- Python
After BigQuery handled the large-volume preprocessing, I moved into VS Code for the more customized and iterative parts of the pipeline. Python allowed me to roll the DMA-level data up to the state and national levels using refined population-weighting logic that would have been cumbersome, unreadable, or impractical in SQL. VS Code also enabled me to integrate the OpenAI API to automatically categorize all search terms into category labels. This stage let me apply flexible logic, run custom functions, and produce the final cleaned datasets that powered the Tableau dashboard.

Feedback
Anonymous feedback is welcome. All fields except the message are optional.