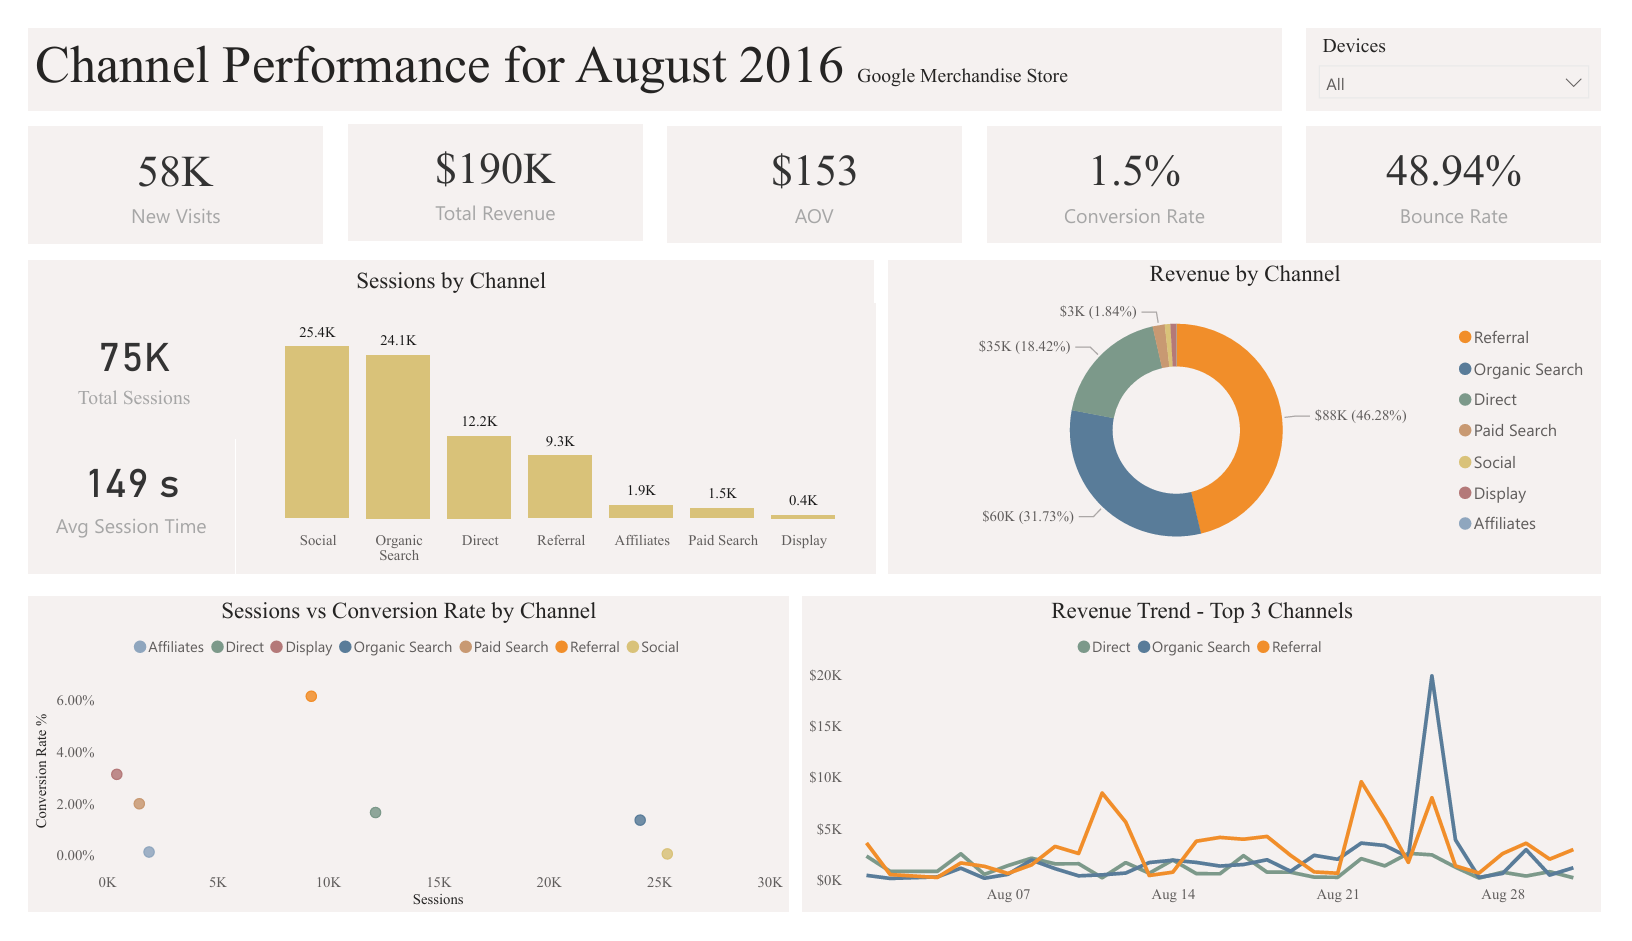
This dashboard provides a snapshot of digital channel performance for August 2016 using the Google Merchandise Store traffic data. It explores how different traffic sources contribute to sessions, revenue, and conversions, making it easy to compare channels by both scale and effectiveness. Built in Power BI, the dashboard helps surface which acquisition channels are driving meaningful engagement and revenue, offering a clear view into where marketing efforts are performing well and where there may be opportunities to improve.
PowerBI Snapshot
Recommendations
This highlights an opportunity to improve revenue efficiency by changing the channel mix. While Social drives the highest session volume, its conversion rate is significantly lower than other channels, indicating lower intent traffic that contributes less effectively to revenue. In contrast, Referral generates the strongest conversion rate and accounts for the largest share of revenue, making it a more efficient acquisition source. Reallocating a portion of paid Social investment toward high converting referral partnerships will most likely improve overall marketing performance and return on spend.
PowerBI - Table Relationships
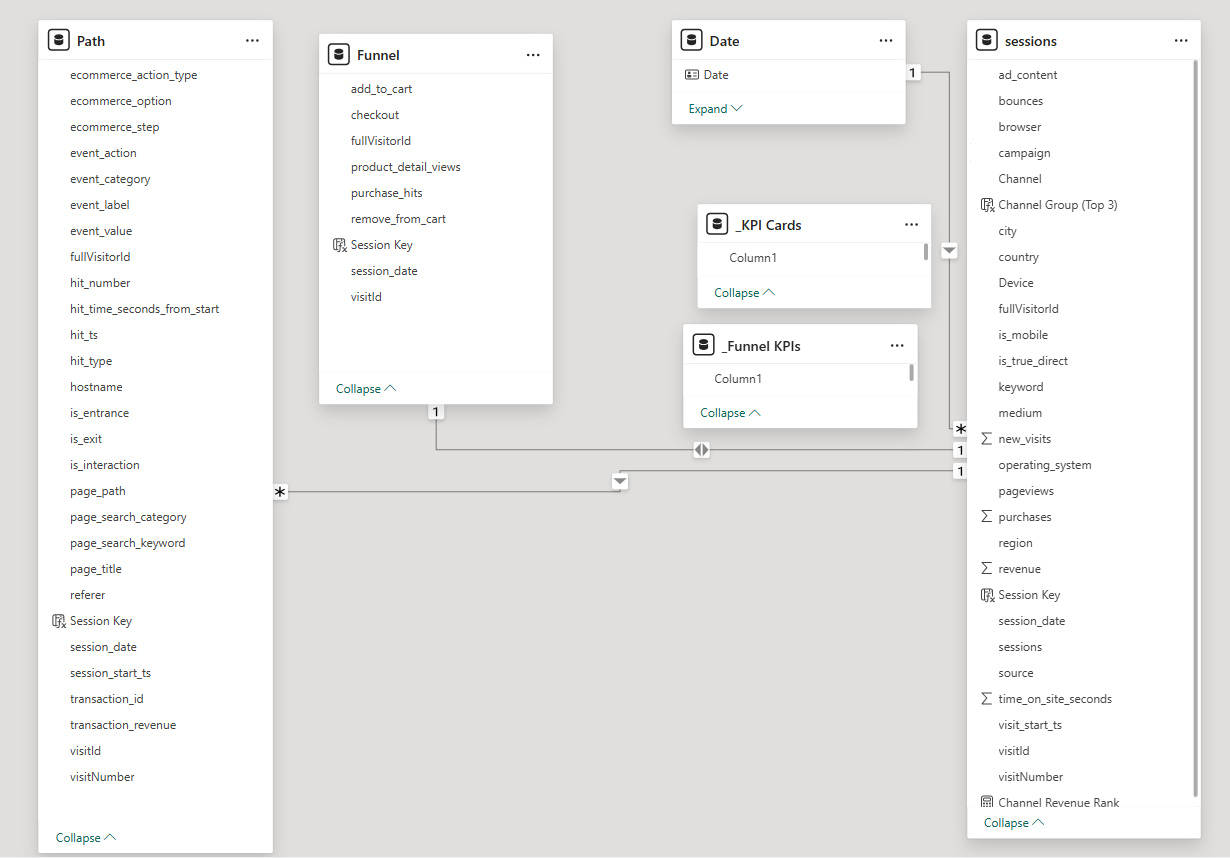
This model uses sessions as the core table, linking session level traffic, engagement, and revenue to detailed user interactions in the Path table and summarized ecommerce steps in the Funnel table. All tables are connected by Session Key and Date to enable consistent filtering and accurate funnel and performance analysis.
Feedback
Anonymous feedback is welcome. All fields except the message are optional.