
A B Testing of Store Layouts for Retail Performance
This project evaluates whether a new store layout increased performance in three trial stores; store 77,86, and 88. Using Quantium’s sales data, I matched each trial store with a statistically similar control store and compared their results during the February–April 2019 trial period. The analysis quantifies the true impact of the layout change on sales and customer activity to determine whether it should be rolled out more broadly.
Trial Performance Overview
The trial layout showed meaningful signs of success. Across the trial period, the participating stores consistently outperformed their matched controls, suggesting that the new layout positively influenced both customer traffic and overall sales.
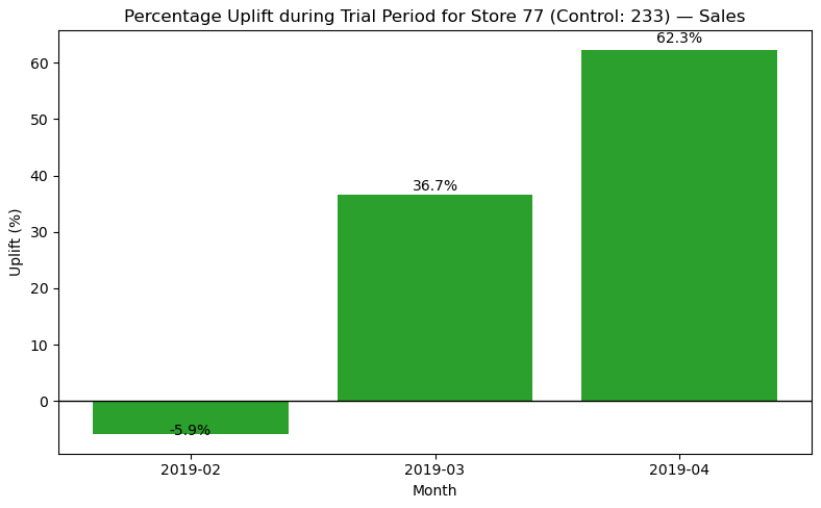
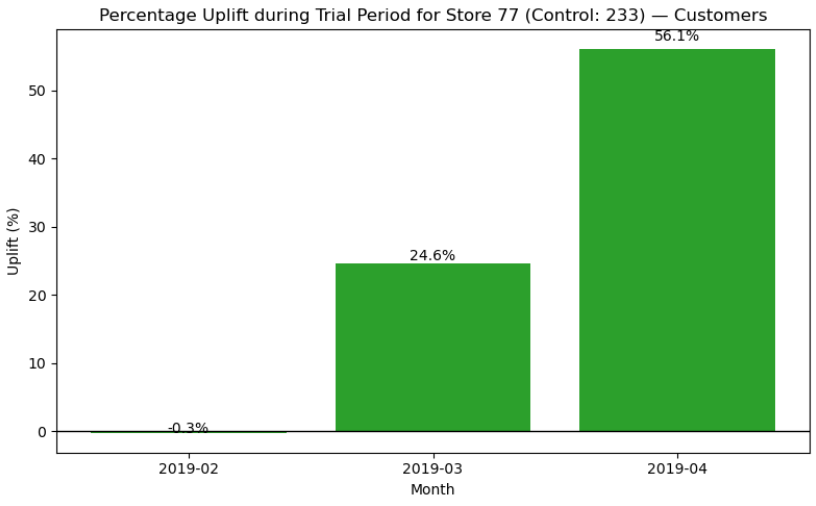
Store 77 demonstrates a clear uplift in total sales and customer traffic during the trial period, suggesting that the trial layout positively influenced store performance.
All methods and trends were repeated and observed for trial stores 86 and 88
Control Store Extraction

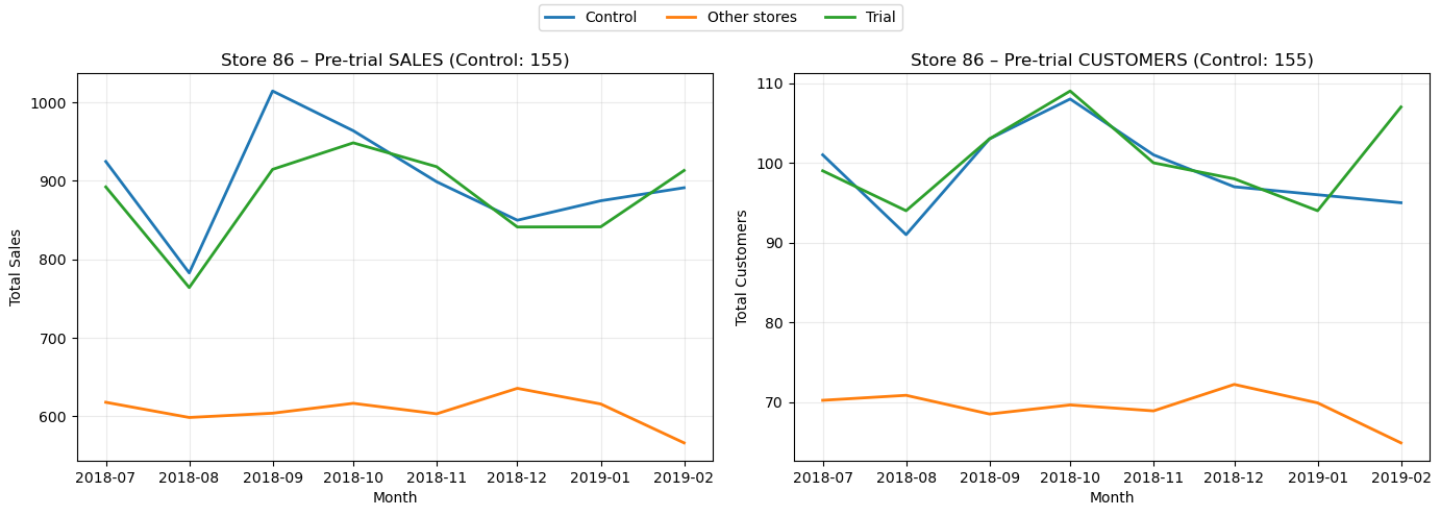
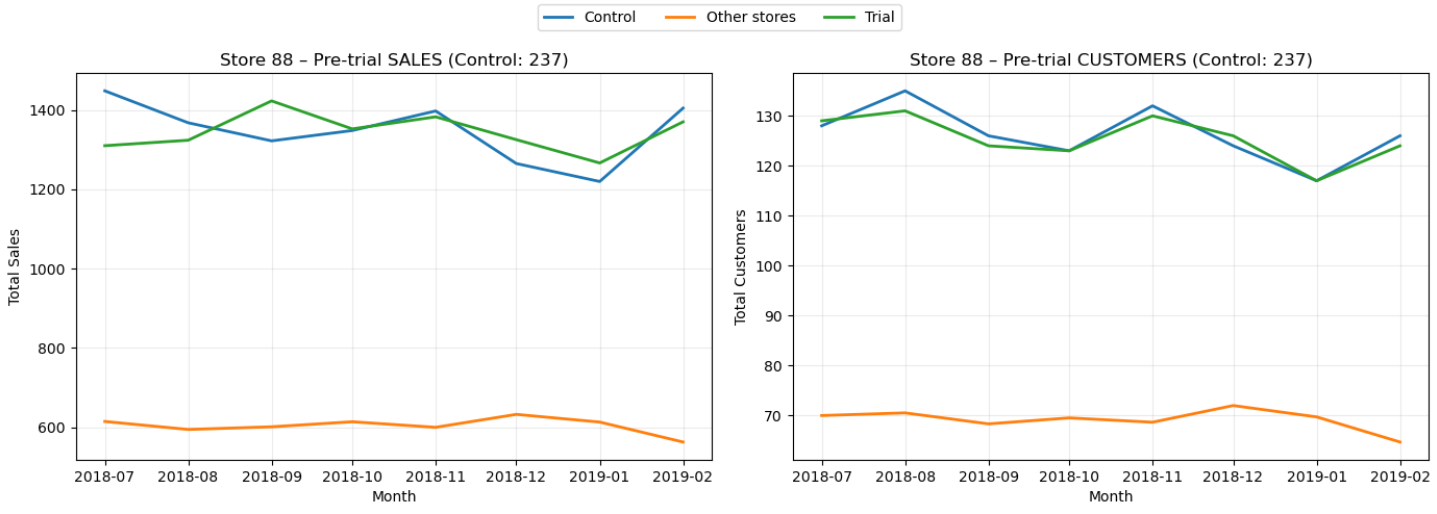
The similarity graph confirms why Store 233 was selected as the control for Store 77. Each potential control stores was scored using correlation and standardized magnitude distance for monthly sales and customers, with each metric weighted equally at 0.5 (0.5 *correlation + 0.5*magnitude distance). Store 233 achieved the highest combined similarity score, and the graph shows that its month-to-month trends closely track the trial store throughout the entire pre-trial period.
Assessing Trial Performance
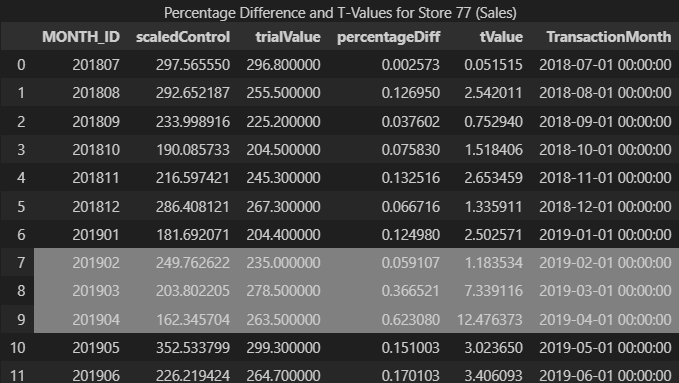
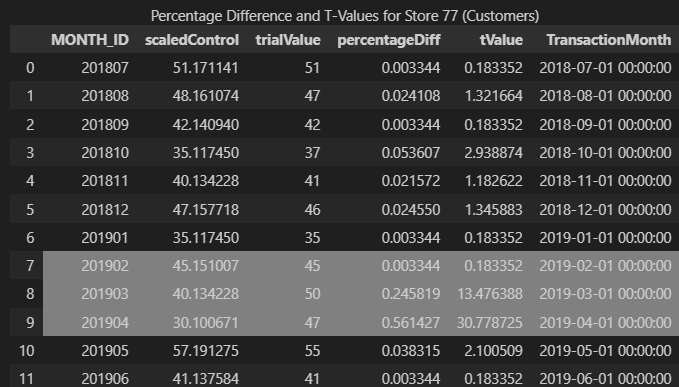
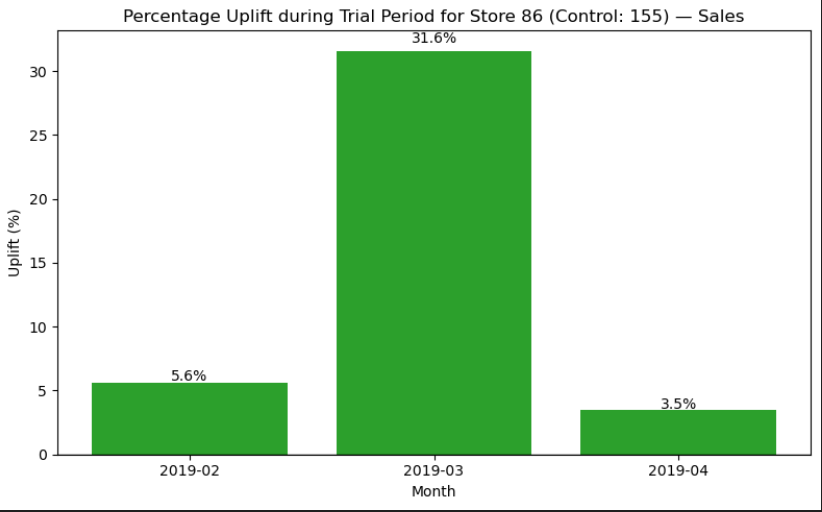
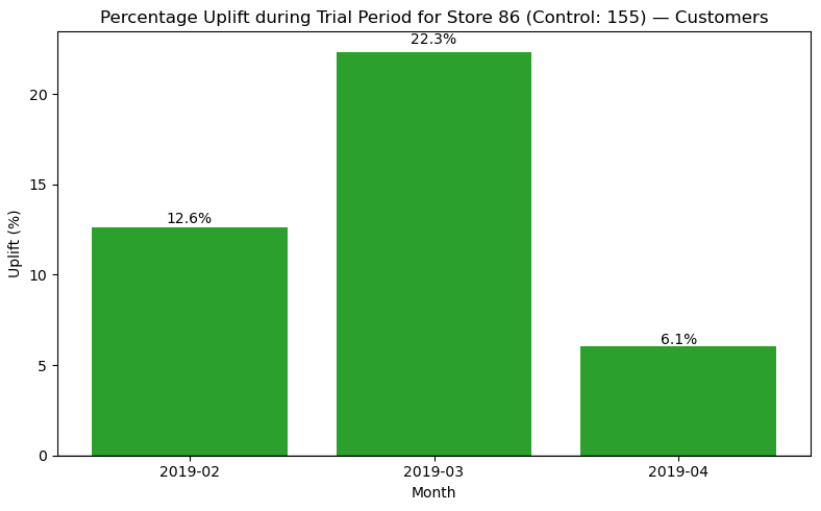
This table shows the monthly percentage difference between the trial store and the control store (store: 77), along with the corresponding t values. The control store was scaled to match the trial store’s pre trial performance so the comparison is fair. In simple terms, the scaledControl values represent what we would expect the trial store’s performance to be if nothing had changed. The pre trial months show the normal level of variation between the two stores, and the shaded rows represent the trial period. March and April show much larger t values and uplift percentages compared to normal variation, which indicates the trial had a real and meaningful impact. February does not show a meaningful difference, likely because it was the first month of the trial and the full effect had not taken hold yet.
Visualizing Trial Impact
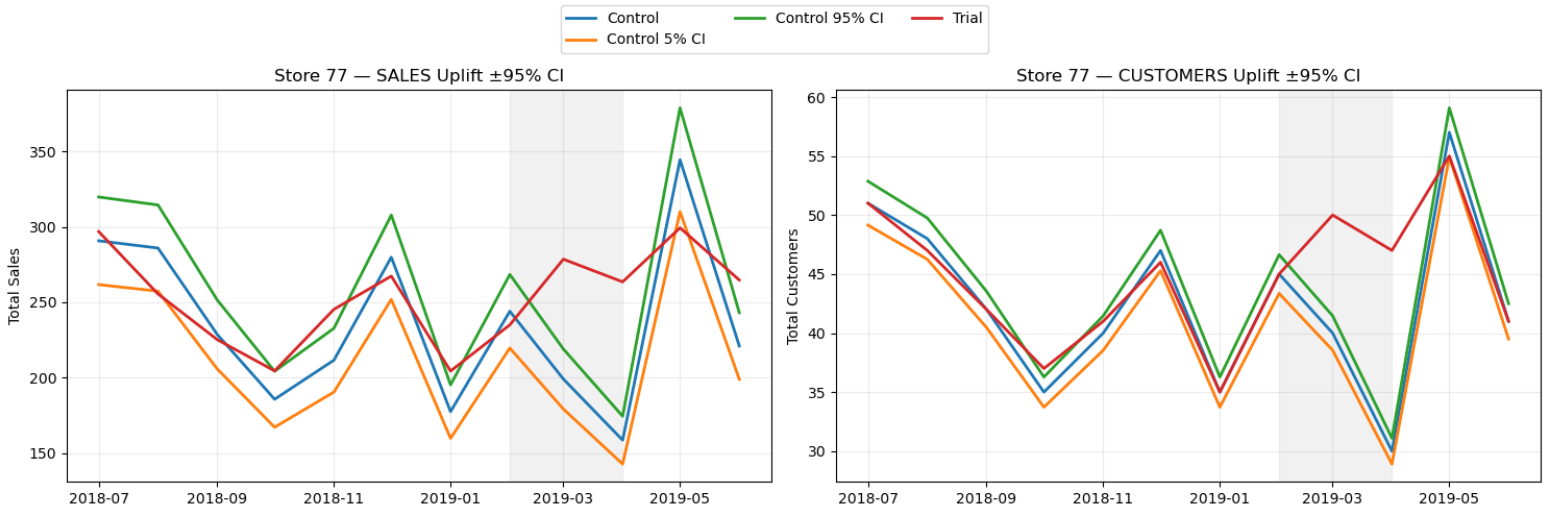
The shaded region marks the trial period, and the confidence interval bands show the expected range of variation based on pre-trial behavior, with 95% being the ceiling and 5% being the floor of expected values. During March and April, the trial store’s line rises above the upper confidence boundary, indicating performance that is significantly higher than what would normally be expected. February remains inside the confidence band, suggesting that the uplift effect had not yet fully taken hold at the start of the trial. Overall, the trial store’s performance becomes meaningfully stronger once the trial is underway, from March onward.
Trial Stores 86 & 88
Conclusion and Recommendations
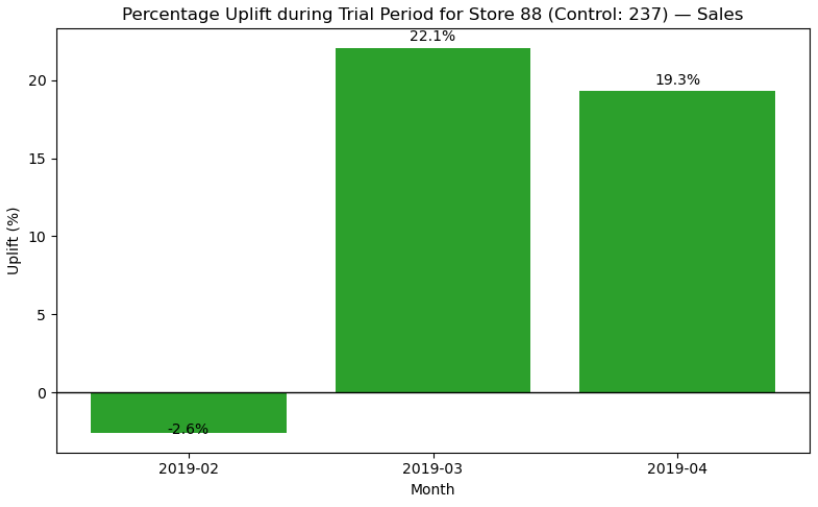
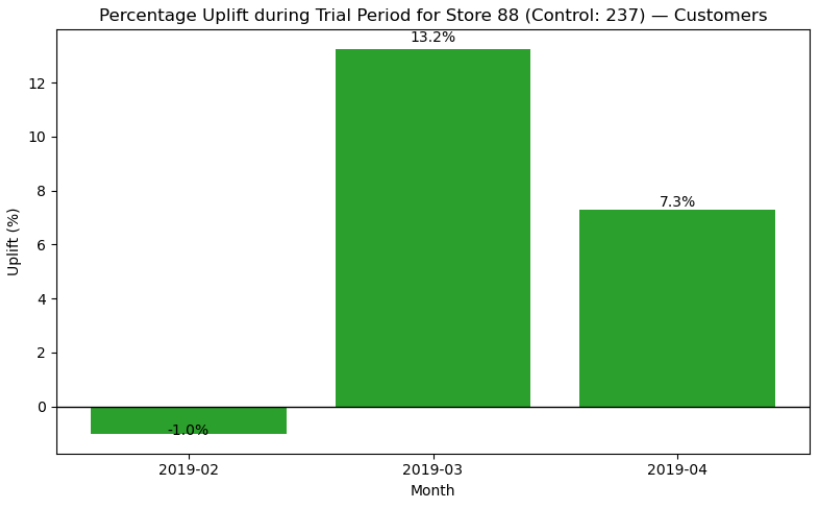
All trial stores were well matched with their control stores prior to the trial, confirming that the impact observed during the trial period is attributable to the new layout rather than underlying differences in store performance. Store 88 shows a strong and consistent uplift across both sales and customers in March and April, demonstrating a clear positive response to the layout change. Store 86 also shows meaningful uplift in March, although the effect softens in April, indicating a less stable but still positive impact. Combined with the strong results already observed for Store 77, the overall evidence suggests that the new layout is effective.
Since two of the three stores show sustained improvement and the third still displays positive but variable results, a broader rollout of the new layout is recommended. Store 86 should be monitored during rollout to understand why its uplift tapered, but its performance does not suggest that the layout is ineffective.
JUPYTER NOTEBOOK
Feedback
Anonymous feedback is welcome. All fields except the message are optional.